Power training has been around for a while now. Most of the training methodology is based on the foundation work done by Hunter Allen and Andrew Coggan. A great deal of credit goes to them in developing the fundamental parameters that we use today to measure athlete performance with power meters.
Through these three articles, I’ll uncover some of the frustrations I have when working with power, the workarounds that I use to get around these and explain some common misconceptions.
This information is based on my real life experiences working with athletes who are using power meters. I’ll try to keep it simple so that you can apply this information to your training.
So let’s get into it.
Since the dawn of competitive cycling, coaches and athletes have been striving to measure how much training load is required to simulate the desired adaptation.
When I started training in the early 1980’s back in NZ we didn’t have heart rate monitors, power meters, home trainers or even digital computers to measure training load. Back then I used a map, a diary, and a Seiko Sports 100 digital watch.
I would time my ride to school as well as how long it took me to ride around my 50, 70 and 100-mile routes. For testing, I would ride up to Petone twice a week in the morning and time how long it took me to ride back to the railway station.
While it wasn’t terribly scientific training, it did help me place at almost all the time trials I entered. Including silver at the Centre Championships (equal to the State Championships here in Australia) and Bronze at the Nationals. There was a downside to this. I wasn’t doing any sprint or lactic threshold training, so when I got to the end of a road race, I was unable to wind the bike up fast enough before the sprint and often used to watch my competitors cross the line and celebrate their success before I got there. I’d also get dropped on short, punchy climbs.
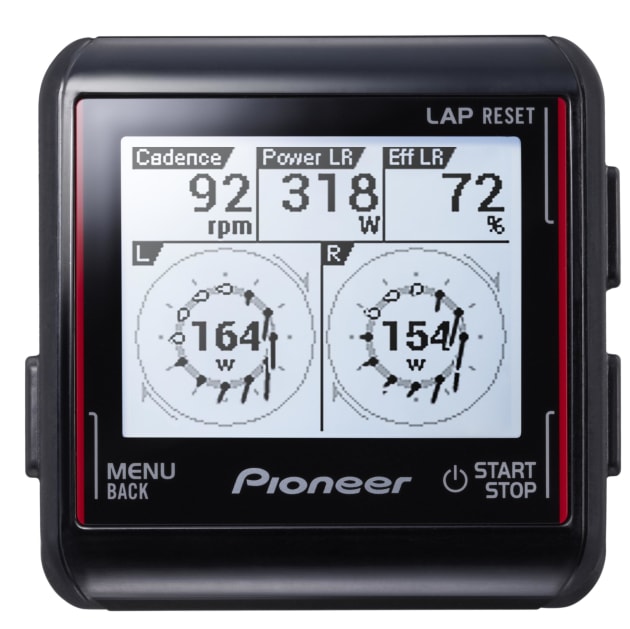
Apart from a few bike computers which provided a more accurate measurement of km’s, cadence and time on the bike my next major device was the Polar 710 Heart Rate watch that I purchased in 2001. Awesome. Jodie bought me the power meter that went with it for my birthday a year later. This first power meter I owned was a bit of a random number generator as the power reading would deviate by 20+ watts when I went from the big chainring to the small chainring.
The movement from using heart rate to power has provided coaches and athletes a far greater insight into answering the training load question.
So, why is training load important?
As a coach, I spend most of my time managing my athlete’s training load. It’s an important part of what I do with my clients.
Simply put, if you train too hard, ramp up your training too quickly or train too hard for several weeks there is a good chance that you’ll get injured or sick. Illness is nature’s natural way of telling you that you have your training load wrong. So if you are getting sick all the time, then the answer will lie in the way you are managing your training load or lack thereof.
On the flip side, if you don’t train hard enough then you won’t maximise your potential as a cyclist. This is because you aren’t stressing your body hard enough to get the appropriate fitness adaptation.
Remember, it’s the training load that stimulates the adaption, but it’s in the recovery where the adaption happens. To manage this, I cycle my athletes through a four-week cycle which is made up of a three-week build followed by a one-week recovery. If I’m training athletes over 65+, then it’s a little different. The four-week cycle becomes a three-week cycle made up of a two-week build and a week’s recovery to provide more frequent recovery.
If we didn’t add the recovery, then the athlete will plateau, start going backward, then become overtrained, then sick. It’s this balancing act that I’m doing with my clients all the time to ensure that we maximise their fitness development through overload and recovery.
Along with these four or three-week blocks, I also work my athletes through proven “Contrast” and “Optimised Block Periodised training” methods. I build in cycles of aerobic base building, strength and speed phases while I’m monitoring their training load to ensure that we are hitting the numbers.
Training Stress Score
When I first started, I could only measure weekly training load by adding up my total ride time and miles ridden. Then with the Polar Heart rate monitor, I could measure time in training zones and vertical metres climbed.
With the advent of power, we can now measure training load fairly reliably with the TSS formula.
TSS is explained in Hunter Allen and Andrew Coggan’s book titled “Training and Racing with a Power Meter.” And, just like max heart rate is used to determine your heart rate zones, your Functional Threshold Power or FTP is used to calculate your TSS. It’s a number that is given at the end of the ride and estimates how much training load the ride was. It’s also used to draw up your performance management chart; which I’ll cover in my second article. It’s calculated with the following formula: TSS = (s x W x IF)/(FTP x 3,600). If you need more details just Google Training Stress Score. Typically, a hard indoor training session will give you a TSS score of around 70-80 while a hard three-hour ride, around 240 TSS.
Because TSS is based on your FTP, it means that I can compare training load from one athlete to another. So if I had an athlete with an FTP of 170 and another with an FTP of 240 and they both went out for a ride and did a TSS of say 320 then the training load placed on them for that ride should be similar.
While TSS is currently the best way we have to measure training load, there are some issues with it. Even Andrew Coggan has admitted that TSS is at best an estimate, not an absolute.
Now we expect TSS to be like for like between athletes, but I have found it to be a little nonlinear. In the data that I’ve seen over the years, I’ve found that athletes with a lower FTP will be able to cope with a greater weekly TSS score than their fitter counterparts. So an athlete with an FTP of 170 will find a ride of 240 TSS slightly easier to achieve that an athlete that has an FTP of 320.
The other issue with TSS is that it’s skewed by time on the bike. The longer you ride, the greater the TSS will be; understandably so. The longer you spend on a ride, the more training load you accumulate. So this means that you can do a heap of low-intensity rides a week and build up a mega TSS at the end of it. And, while a big TSS number is supposed to mean that you are getting fitter and will reflect this in your performance management chart it doesn’t take into account what your training is made up of.
Just like with my time trial training. Because I focused on one thing for which I became quite good at, it meant that I had deficiencies in other areas of my performance. And, this led to me being dropped in races on short steep hills and not having enough power to contest the sprints.
So, just because your performance management chart is going through the roof doesn’t mean that you are training efficiently and using your precious training time wisely. I’ll cover off building training programs in my third article. But understand this. If you don’t spend time doing hill work, don’t expect to be a good climber regardless of your weekly TSS scores.
Finally, some of my athletes take their performance management chart too literally. As I’m working my athletes through their program, there will be weeks where we’ll be cutting volume and increasing intensity. As a consequence their weekly TSS will reduce, and this is reflected in their performance management chart. If literally interpreted, their performance management chart is saying that their fitness is dropping when it’s not. The reason why it’s dropping is that we are just doing less volume while we are focusing on the specialization phase of their training. Regardless of this, it does mess with the heads of some of them.
When it comes to measuring training load Strava uses a number it calls “Suffer Score.” Suffer Score like TSS, will, will give you an indication of how hard your rides are. The suffer score also feeds into their Fitness & Freshness chart. And their Fitness & Freshness chart is equivalent to the way TSS feeds into the performance management chart.
If you are using a heart rate monitor, then Strava will use your cycling data to guestimate your rides’ Suffer Score. The Suffer Score that is calculated without having a power meter on your bike is fairly accurate if you ride alone. But, it will give you a wildly inaccurate number as soon as you start drafting in a fast moving bunch. Knowing a bit about power I use to have a good chuckle to myself when I got back from such a ride and looked at the ridiculously high Suffer Score that Strava gave me.
However, once you get a power meter connected to your Strava, the Suffer Score number will be very close to the typical TSS score that Hunter Allen and Andrew Coggan’s formula calculates.
TSS and your Suffer Score provides insight into how many days of recovery you need. Here are some guidelines as to the recovery time after a ride of various TSS’s
• Less than 150 TSS, recover completely by the following day
• 150-300 – residual fatigue the following day but recovery complete by the second day
• 300-450 – fatigue may be present after two days
• 450+ – fatigue lasting for several days.
Establish Your TSS
So to get a reliable weekly TSS score and to build an accurate performance management chart you need two things.
Firstly, you need a reliable power meter. While you can do a heap of research out there on which power meter to buy and we certainly have quite a bit of lively discussion between members in our member’s area online forum, making a recommendation about your power meter purchase is beyond the scope of this article. What is important is that the data coming from whatever power meter you purchase has to be accurate all the time. Many a time I’ve had to deal with glitches in the power data and its impact on the accuracy of the analysis of my client’s weekly training data.
Secondly, you need to measure each and every training session to get an accurate performance management chart. So if you ride two bikes, they both need to have a power meter that has a similar calibration.
So that’s all great, but one of the issues with power meters and Strava is that we can now accurately measure our personal bests (PB). Whether it’s a Strava segment or FTP, cyclists, being naturally competitive want to go out and see their PB’s get better. It’s natural to want to do this; we want to know if we are getting better. Chasing PB’s all the time is fraught with danger because the athlete is always over stretching. As mentioned, proper training involves moving the athlete through various training phases to develop them as a whole for their chosen discipline. In the build phases, that training load may be so great that you might not see any PB’s because you are so fatigued.
We would normally see PB’s in the recovery phases of your training. Unfortunately, chasing PB’s ends up diverting your focus to short-term goals and will influence you to focus on smashing yourself over on every ride. This loss of focus from a properly periodized training program is a really, really bad way to train. When I start working with a new client that doesn’t have much historical data to work with I’ll keep loading them up with training and then wait for their PB’s to start dropping. That way I get a good indication of where to benchmark that athlete’s initial training load.
So what should you target for your weekly TSS score?
For my clients that are doing between 8-12 hours of training a week, a TSS score of 500+ is a good week. We target around 500 or a little less for the recovery weeks and around 750 for the build weeks. For maintenance or off season, 300 TSS is fine. This is dependent on where they are in their program, how fit they are, what they are training for and what phase of their training that they are in. Sometimes we’ll do some epic 1,000 or 1,200 weeks like at our Bright Boot Camp that we run in Bright twice a year. But, we never run 1,000+ TSS for more than two or three weeks and generally not over two consecutive blocks. I’ve also found that the women that I coach are much better at managing big sustained build weeks better than the blokes.
Even with its flaws, TSS is still the best way that we have at the moment to measure training load. It’s a fundamental metric that I use to coach my athletes. But, understand that TSS is not an absolute measurement, so needs to be interpreted based on where you are at in your training cycle and what training you are doing.
So I’ve just really started with this. There is more to come in the next article where I answer the questions about how to set your training load and intensity. I’ll also discuss the difference between heart rate and power training. I’ll introduce something that I created called variable power zones to overcome the issues with basing power zones on FTP and go over IF threshold testing, the mean maximal power curve, and normalized power.
