
In my last article, I went into some detail around using Training Stress Scores (TSS) to make sure that you are training hard enough, but not so hard that you get sick or overtrain. I also discussed some of the issues with TSS and what I look for to help manage my athletes.
So why do you need to set up you power zones?
Just like with heart rate, power zones help my athletes train at the right level of intensity during each workout. The more accurate they are at doing this the faster they can reach their cycling goals.
The goal of a structured training program is to specifically develop the athlete’s fitness so that they achieve their training goals in the most efficient and time saving way. How I do this is that each of my training programs details the duration, cadence, vertical meters and intensity of each of the workouts. This helps communicate to the athlete what is required of them as they progress though each of the workouts in the program.
The level of intensity of each workout is critical as it targets the development of specific areas of their fitness. Plus, each of the weeks is planned around an overall weekly training load that’s designed to build the athlete’s fitness, but not have them become overtrained.
In the next article, I’ll be talking about how to use these zones to develop different aspects of your fitness but before we get into that we need to set up your power zones.
Comparing Heart Rate and Power Data
Power zones are like the heart rate zones but with two additional zones Anaerobic Capacity (ANC) and Neuromuscular Power (NUE). The simple reason that there are two additional power zones is that now we can measure them with power meters.
Here is a table measuring the mean maximal heart rate and power values for various intervals of time from data taken from a typical masters’ road race.
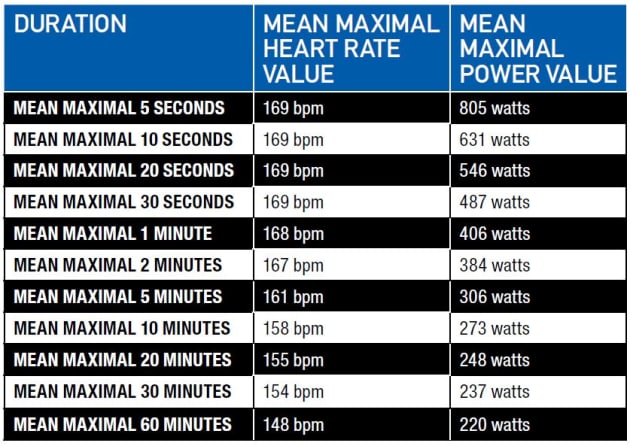
Table 1. Mean Maximal Heart Rate and Power values.
As you can see from this chart the heart rate values from five seconds duration right down to the two minute mark, change by just two heartbeats per minute. However, the power data provides much more variation with power values starting at 805 watts and then progressing down to 384 watts.
While heart rate zones are based on a percentage of maximum heart rate (MHR), power zones are based on a percentage of your Functional Threshold Power or FTP. Your FTP is your personal best 60 minute mean maximal power value, or if that is not available, 1.05 times your 30 minute mean maximal power value.
Heart Rate and Power Zones compared
To keep it simple I’ve tried to line up heart rate and power zones as much as possible. I’ve taken some poetic licence to do this, so these may not reflect what are considered the standard classical descriptions for these zones. While HRM and power are a similar system, they are incompatible with each other. I therefore highly recommend that you train with either your heart rate zones or your power zones, but not both, to avoid confusion.
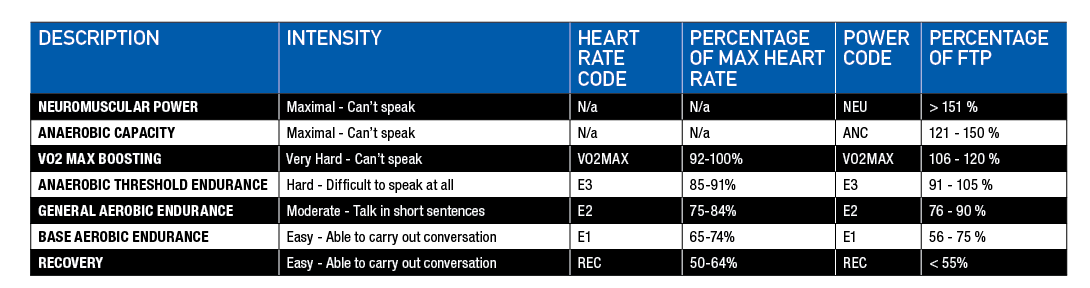
Table 2. Cycling Australia Heart Rate Zones Vs Power Zones from “Training and racing with a power meter” by Hunter Allen and Andrew Coggan (with a little poetic licence)
How to work out your FTP
So now that you have a handle on both heart rate and power zones let’s talk about how you work out your FTP.
If you decide to do your FTP testing on your home trainer, you’ll get a lower number than you’ll get out on the road. I don’t know the reason why this happens, and I’m sure that there is a biomechanical scientist or sports physiologist that can explain this.
Rather than getting my clients to do a one off FTP test I prefer to use their last 60 – 90 days of data to calculate FTP as it’s much more accurate.
When power meters were first available, they were expensive, and athletes only got occasional access to them in labs. So initially FTP tests were done on a monthly or quarterly basis to measure progress. The issue with doing one-off test this way is that the athlete might get tested on one of their bad days and consequently their resulting FTP number may not be reflective of their actual FTP.

The good thing is now that instead of going to a lab to be tested, the athlete has a power meter installed on their bike and we measure power data every time they ride. This greatly reduces the chance of error from testing on a bad day.
If you are using Strava with a power meter it will automatically calculate an FTP value for you based on a similar method, so will many other power analysing software applications. This is the most accurate way of getting your FTP rather than a one-off test.
If your software doesn’t calculate your FTP for you, then you can do what I did for years and slowly raise the FTP figure in the software until my athletes IF numbers started falling below 1. IF stands for intensity factor, and I discussed this in my previous article.
If you want to manually calculate your FTP you can take your normalised power for an all-out effort for 60 minutes or you can get a fairly accurate estimate by doing an all-out effort for 20 minutes, then subtracting 5% from the average power value for that interval.
The big problem with Power Zones
Now that you have your FTP you can work out your power zones. Unlike heart rate zones where there is no stipulation as to the duration of the effort, power zones do have durations.
They are as follows:
• NEU – less than 30 seconds
• ANC – 30 seconds to three minutes
• VO2MAX – three to eight minutes
• E3 (Lactate Threshold) – 10 to 30 minutes.
Let’s take another client’s data. His FTP is 270 watts and I’m going to punch this number into my power zone calculator and determine his theoretical power zones:
Now let’s look at the athletes ‘real life’ mean maximal data for the last five months and compare this with the theoretical zones:
Mean Maximal 1 minute 488 watts
Mean Maximal 5 minutes 346 watts
Mean Maximal 20 minutes 284 watts
In our training programs, we have quite a few indoor training sessions that we work our athletes through. Let’s take our ‘082 – Hill Climber Seated and Standing with Arm Swaps’ session. It has six 5-minute efforts done at E3 (246-284w) at various cadences that are designed to build hill climbing strength at low cadence, as well as aerobic capacity and core strength. You can download a copy of the timing sheet from this link: http://bit.ly/2ejSP5M.
We’d normally do these at E3, but for this example, we’d ask our athlete to do them at VO2MAX (286-324w) because his ‘real life’ five minute mean maximal data is closer to VO2MAX than E3. If he was to do these efforts based on the theoretical power zones, his efforts would have been done at a lower intensity than he was capable of.
It gets worse. If we were to have him do one-minute efforts as we do in our ‘087 – E3 or VO2Max Break Jumpers and Mini Break Jumpers’ indoor training session, his theoretical ANC Zone as calculated by my power software would have prescribed an effort between 327w and 405w which is low based on his real life mean maximal 1-minute effort of 488w.
When we look at training to improve his 20-minute power level, he’d do these sessions in E3 because VO2MAX power zones are only between three and eight-minute efforts. His theoretical FTP E3 zone is worked out at between 246w and 284w.
However his best ever 20-minute effort is 284w, so, finally his zones are starting to fall into place. This assessment needs to be made for each individual…each of you will have a different mean maximal power curve, and some of you will fall into the E3 power band for twenty minutes while others won’t. More on mean maximal power curves later in this article.
As you can see, the longer the intervals the more accurately the theoretical zones determine the intensity of you efforts….while the shorter intervals may require closer attention, and comparison to, the real life data you collect over time to ensure you optimise your training efforts.
Bear in mind you may need to change the zone you train in based on the duration of the effort you require during your race or event.
Variable Power Zones
Years ago, when I started to work with power I came across these problems, so I developed my variable power zone system.
I work out a customised target band of power, based on a percentage of my athlete’s actual mean maximal power figures for various interval periods.
For example, I worked out the following figures for the above athlete:
For a VO2MAX Effort:
1 min 464 – 488
5 min 329 – 346
20 min 270 – 284
These will become more accurate as the rider tracks their performance, collecting more data and refining their personal power curve.
The Mean Maximal Power Curve
If you use Strava and power, then you’ll probably have seen this chart.
It’s a graph that plots your best mean maximal power figures over time. It’s a fairly simple graph and provides insight into the type of rider you are; whether you are an all-rounder, sprinter, time trialist, hill climber or steady state rider or a pursuiter. I often go to this chart to get my client’s mean maximal power figures so that I can work out their variable power zones for various intervals. This is useful if they have a hill repeat in their local area. Say it took them 12 minutes and 37 seconds to climb. I’d get their 12 minute mean maximal power figures from this chart and use it to create a power zone specifically for this climb that they can track on their power display while they are climbing it. If your power analysing software allows it, you can plot two lines on this graph. One set at the last 30 days and the other as a benchmark from your previous year or season. That way you can see where you are with your current training against your benchmarked power curve.
Normalised Power
When you come back from a ride, your power meter will give you an average power figure; the average power that you put out for the entire ride. When you go out for a ride or do a training session, you’ll be riding over a wide range of power levels. This is influenced by changes in elevation, gusts of wind and other external factors like the road surface you are riding on. You only have to look down at your power meter at any given time and see the power number fluctuate in response to these changes in resistance. Also, if you were to do a training session that involved quite a few high-intensity intervals along with lots of recovery time, your average power won’t reflect the true nature of the session. The same goes for your ride if you had large variations in your power levels. This becomes even more important when you are racing as you may spend quite a bit of time well above your average power level for the ride. In all cases, the average power figure will average out your power for the ride. To compensate for this, there is a measurement called Normalised Power. It considers the time spent above your average power during the ride and provides a better indication of how hard the ride was. Comparing the variation between your average power and your normalised power gives a more accurate gauge of the intensity of a ride, than simply checking the average power figure.
Finally, repeatability
While Normalised Power does provide some indication of how hard a ride was, it’s still a number that I consider absolute and isolated. FTP, Mean Maximal, Average and Normalised power figures are all affected by immediate fatigue…and the riders resistance to it; their ability to go, and go again. I work with a few awesome time trial athletes who have very good FTP figures; above and beyond the average rider. Because of this, you might expect them to be very good riders in all races. But it’s not the case. Many times, these riders are poor sprinters and would be lucky to peak out at just over 1,000 watts. So you won’t see them at the front of a bunch sprint where they need to be producing over 1,400 just to be in contention. Also, during a criterium race it’s not your FTP or Normalised Power figure that’s important, although it does help. It’s more about how many times you can punch up into a 750-watt effort for the hour and how quickly you recover from it. Your ability to manage this will determine how well you manage the decisive moments. The same goes for riding handicap races. You still need to be able to momentarily punch up over it when you are on the front doing your turn, then recover quickly to do it again and again during the race.
So, I hope that helps throw some light over the calculation of power zones for your training. In the next article, I’ll be talking about how to measure your performance, get feedback from your data and use it to tune your training.